| Summary: What is bowtie analysis and how do Bowtie diagrams help in the risk assessment process, here is a detailed discussion on bowties and the step-by-step procedure to develop bowties diagrams to find high-risk events in a process industry. |
Introduction
The Bowtie analysis is a qualitative risk assessment methodology that provides a way to effectively communicate complex risk scenarios in an easy-to-understand graphic format and shows the relationships between the causes of unwanted events and the escalation potential for loss and damage.
Bowtie can display the commands, that prevent the Top event from happening primarily, specific to each threat, and the recovery measures that are ready to limit possible effects once the Top event has been accomplished, specific for each credible result.
Bowties are commonly developed in the Oil & Gas Industry to represent (pictorial) the relationship between potential threats, preventive/ mitigative barriers in place, and the ultimate consequences associated with each Major Accident Hazard (MAH).
Bowties aims to provide the right level of detail to facilitate understanding and risk-based decision-making without oversimplifying. The right level of detail depends on the project objectives and goals.
What is Bowtie Analysis?
Bowtie Analysis introduces itself as a barrier-based risk management tool. It serves as an effective method to visually and systematically manage high-risk scenarios.
By using a diagrammatic approach, Bowtie Analysis maps out the relationship between risks, barriers, and their management. This makes it easier for organizations to identify and mitigate potential threats before they escalate, ensuring safer operational environments.
Visualization and Management of Risks
Through Bowtie Analysis, high-risk scenarios are visualized and managed effectively. A diagram – the Bowtie diagram, is used to show a clear snapshot of various risk elements. These elements include threats, top events, hazards, consequences, risks, barriers, and how they all interconnect. This method helps in understanding and mitigating risks in a structured way.
The Origin of Bowtie Diagrams
The chemical and process industries first developed the bowtie diagram in the late 1970s as a method for assessing and managing the risks in highly complex systems. This concept focuses on evaluating both the likelihood of failure events and their potentially significant consequences in risk management and safety assessment.
The Royal Dutch/Shell Group is often credited with developing the bowtie methodology in the 1990s as part of their safety case development process. Since then, it has been adopted and adapted by various industries worldwide, including aviation, mining, energy, and healthcare, for its efficacy in visual risk assessment and management.
Read: SynergenOG Case Study: Developing a Safety Case for a Client’s Facility
How Bowtie Diagrams Work?
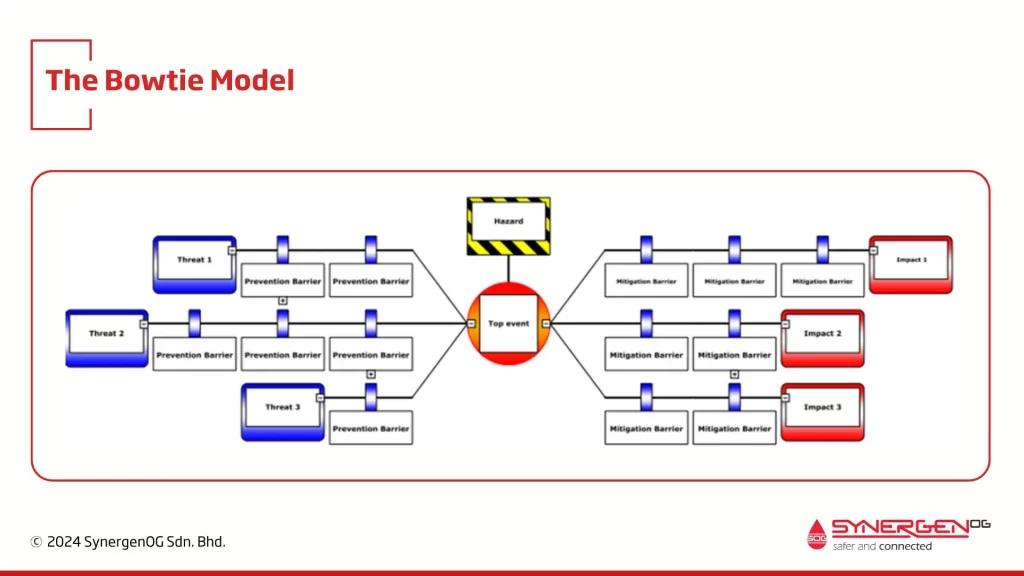
Bowtie diagrams provide a structured method to visualize the complex interplay of risks in various scenarios, especially in environments where safety and operational integrity are critical.
The bowtie diagram is split into three main sections: the left side, the center, and the right side. The left side lists potential threats—these are events or conditions that could cause a “Top Event,” the central focus of the diagram.
The Top Event, positioned at the center of the bowtie, represents a pivotal moment when control over a hazard is lost but before any adverse consequences have occurred. This is the critical juncture where preventive measures can be most effective.
On the right side of the diagram, the potential consequences of the Top Event are detailed. These consequences are what the organisation aims to avoid through effective risk management strategies.
How do you develop Bowtie diagrams?
A systematic approach to developing the Bowtie diagrams is explained below.
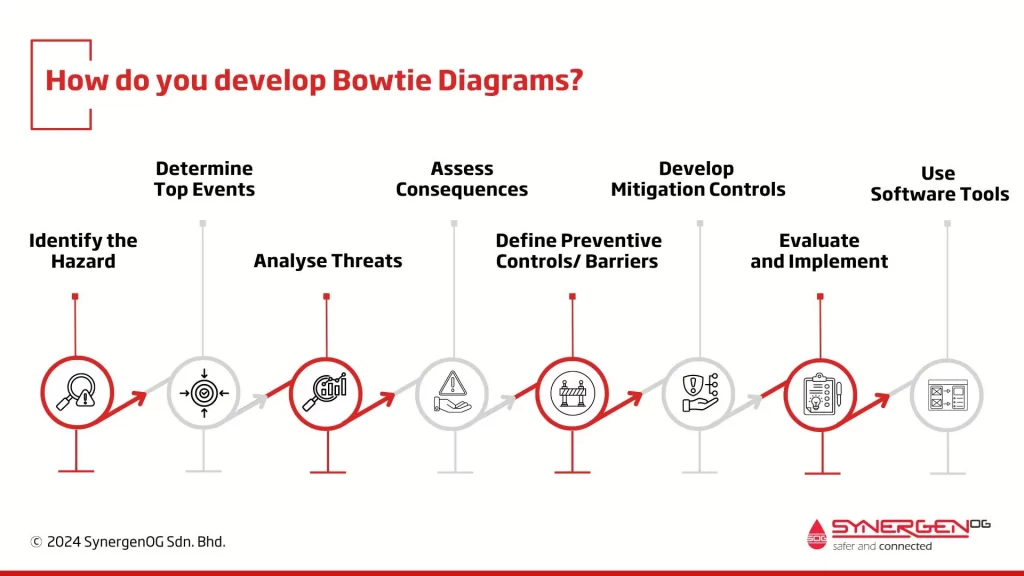
#1. Identify the Hazard
Start by identifying Major Accident Hazards/Events (MAH/MAE). This is the core of your diagram and typically is a situation or an event that can potentially cause harm.
#2. Determine Top Events
Define the “Top Event,” which is the event where the control of the hazard is lost, but the actual loss hasn’t occurred yet. This event sits at the center of your Bowtie diagram.
#3. Analyse Threats
List all possible causes or threats that could lead to the top event. These threats are potential developments that could trigger the hazard, forming the left side of the diagram.
#4. Assess Consequences
On the right side of the diagram, identify all possible consequences if the top event occurs. These are typically the adverse outcomes that follow from the top event.
#5. Define Preventive Controls/ Barriers
For each threat, determine the preventive controls or barriers that can prevent the threat from leading to the top event. These controls could be safety systems, procedures, or equipment designed to reduce the likelihood of the top event.
#6. Develop Mitigation Controls
Similarly, for each consequence, identify mitigation controls that can reduce the impact or severity of the consequence. These controls help manage or lessen the effects once the top event has occurred.
#7. Evaluate and Implement
Assess the effectiveness of each control measure and ensure they are properly implemented, maintained, and continuously improved. This may involve training, regular inspections, or updates based on new information or technology.
#8. Use Software Tools
There are specific software tools designed to help create and manage Bowtie diagrams effectively. These tools can aid in the visualization, analysis, and sharing of the diagrams across the organization.
Some of the popular Bowtie diagram software tools are,
- BowTieXP
- CGE Risk Management Solutions
- RiskyProject
- SafetyBarrierManager
- Arbutus Analyzer
Find Out: SynergenOG Process Safety Software Solutions
Why Bowtie Diagrams?
Visual Simplicity Aids Comprehension
Bowtie diagrams are praised for their visual simplicity, which significantly facilitates the comprehension and communication of complex risk-related information. This simplicity allows individuals at all levels of an organization to easily understand the risks involved in their operations, providing a clearer and more effective dialogue about safety and risk management strategies.
Maintaining Barrier Integrity
The straightforward layout of bowtie diagrams not only makes risk scenarios easier to grasp but also aids in maintaining the integrity of risk barriers.
By clearly depicting the direct relationships between threats, events, and consequences, these diagrams help ensure that all preventive and mitigative measures are correctly understood and implemented, enhancing the overall management of complex analyses.
Explore SynergenOG’s Expertise in Bowties
Take command of your organization’s risk management with SynergenOG, one of the industry’s leading bowtie analysis specialists. Our expertise empowers you to uncover vulnerabilities, develop substantial safety barriers, and maintain operational excellence.
Bowtie Workshops
Get a deeper understanding of Bowtie Analysis through expert-led sessions.
Barrier Risk Management Using Bowties
Let our experts evaluate your risk management strategies, identify gaps, and offer actionable recommendations using bowties.
Barrier Risk Management Training
Enroll in our barrier risk management using bowties training courses, ranging from basic principles to advanced applications, and get professional certifications.
Conclusion
In summary, the bowtie method is a graphical risk assessment method focusing on major accident hazards. The method’s main purpose is to identify high-risk events that could have the potential for either fatalities, significant damage to asset or impact on the environment. Examples of such events are loss of containment, blowout, leak, and fire/explosion.
Performing a bowtie analysis is done by organizing a multidisciplinary workshop where the attendees collaborate to find any flaws, faults, or trigger points in a system that could initiate a hazardous event. This is done by following the logical flow of the bowtie method. In the bowtie diagram, the trigger points are defined by threats on the left-hand side of the bowtie, while the consequences of an event are stated as impacts on the right-hand side of the bowtie. To prevent the threats from triggering a hazardous event from occurring and/or mitigate the degree of impacts, controls/barriers are added on both sides of the bowtie. The idea is to create a package of control measures that is as waterproof as possible.
Finally, the bowtie technique is applicable on a broad scale where actors in various industries can implement this method as part of their risk analysis tools.
If you have questions or want SynergenOG Consulting to help you and your company in a barrier management project, please do not hesitate to contact us