
| Summary: This article explains how Quantitative Risk Assessment (QRA) serves different stakeholders—not just as a compliance tool, but as a practical decision engine. It shows how to tailor QRA outputs for executives, project teams, PSM and operations, regulators, insurers, emergency planners, investors, and communities using tools like IR contours, F-N curves, and more. |
Quantitative Risk Assessment (QRA) is more than a compliance exercise; it’s a decision engine that translates hazards, frequencies, and consequences into actions different stakeholders can own. This post answers “QRA for whom?”- executives, project teams, PSM and operations, regulators, insurers, emergency planners, investors, and communities—and shows how to tailor outputs for each audience: IR contours, F-N curves, exceedance plots, OBRA insights, and ALARP demonstrations.
What QRA Is (and isn’t)
A Quantitative Risk Assessment is a structured method for quantifying the likelihood and consequences of hazardous events—such as fires, explosions, and toxic releases—and demonstrating how design choices and safeguards reduce risk to as low as reasonably practicable (ALARP). QRA sits alongside HAZID, HAZOP, LOPA, OBRA (Occupied Building Risk Assessment), and SIL, targeting to provide the numbers that support high-stakes decisions.
What QRA is not
- Not a guarantee of safety
- Not a one-time “tick-box” exercise
- Not a replacement for engineering judgment, operating discipline, or field verification
Typical QRA outputs used across process safety
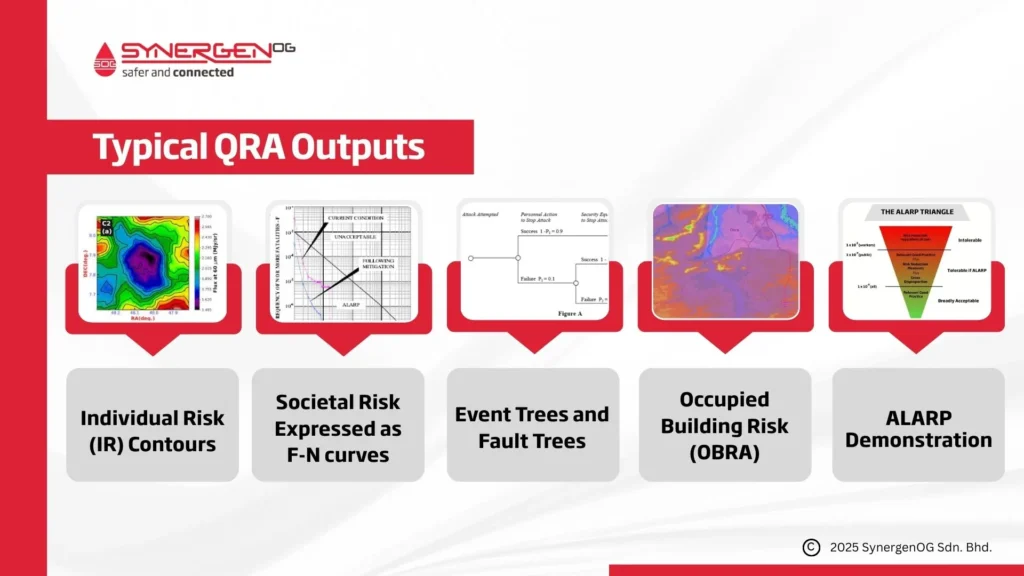
- Individual Risk (IR) contours around the site boundary and sensitive receptors (houses, roads, schools)
- Societal Risk expressed as F-N curves (frequency vs. number of fatalities)
- Event trees and fault trees, contribution analyses, and exceedance curves
- Occupied Building Risk (OBRA) results and siting decisions
- ALARP demonstration: alternatives assessed, costs/benefits, and chosen risk-reduction measures.
QRA for Whom?
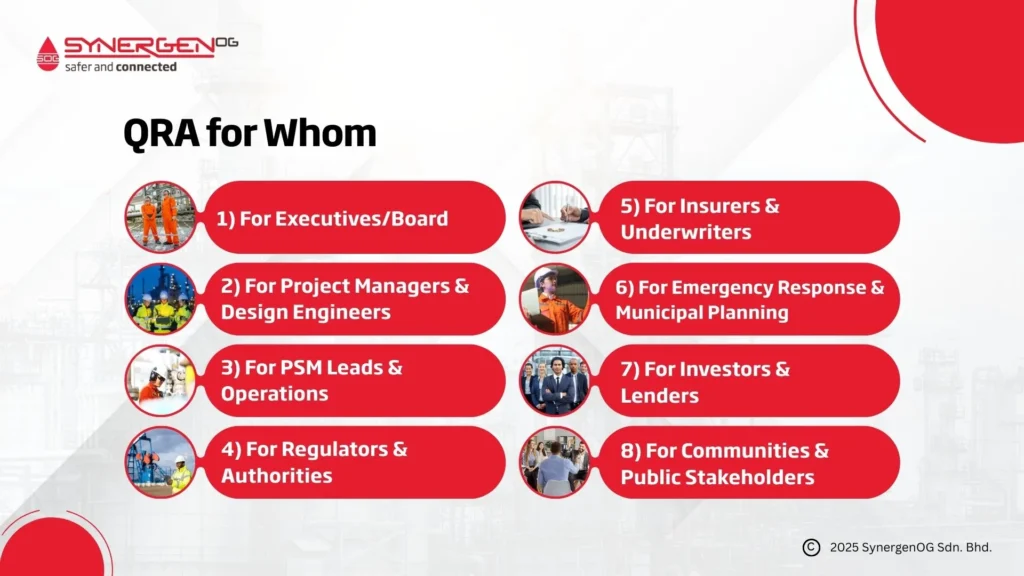
Who really needs Quantitative Risk Assessment—and what decisions does it unlock?
Quantitative Risk Assessment (QRA) serves decision-makers across a facility’s lifecycle—executives, project and process engineers, operations and process safety teams, regulators, insurers, emergency planners, investors, and local communities. Each audience needs different
QRA outputs (individual risk contours, societal risk F-N curves, consequence modeling, ALARP demonstration) to make better, faster, defensible choices.
Before building a model, ask: Who will use the QRA results, and to decide what? Stakeholder clarity prevents over-modeling and under-answering.
A simple mapping like below helps:
Stakeholder → Decision → Required outputs → Criteria → Time horizon.
Example: Project manager → choose between two plot plans → IR contours + sensitivity runs → local tolerability criteria + ALARP → by 30% model maturity.
1) QRA for Executives/Board
For the Board, QRA is not a technical exercise, it is a strategic lens for business continuity and the license to operate. Executives need to know if the facility meets corporate and regulatory benchmarks; if these criteria are missed, the facility is at risk of not being able to operate at all.
Executives need the difference a decision will make, not a wall of numbers. A well-targeted QRA turns sprawling risk into a few crisp deltas:
“If we move this tank farm 30 meters and add passive fire protection, individual risk at the boundary drops a full order of magnitude; societal risk slides into the ALARP band.”
The right visuals are simple tiles—before/after IR or F-N, a waterfall of risk reduction per safeguard, and a short ALARP memo that documents alternatives, costs, and rationale. Precision isn’t the goal—clarity is. Executives should insist on uncertainty bands and sensitivity tests (“What if firewater is down?”). That discipline prevents false confidence and ensures the chosen investment is robust, not just optimal on paper.
You’re deciding:
- Strategic Risk & License to Operate: Ensuring the facility meets the hard constraints required to stay open.
- Capital Allocation: Where to deploy capital efficiently for the best risk reduction per dollar, avoiding over-investment in low-risk areas.
- Reputation & ESG: Managing high-profile risks that threaten brand reputation and meeting ESG transparency goals.
- Project Viability: Whether to proceed, defer, or redesign a project based on risk tolerability.
You need to see:
- A one-page ALARP demonstration: options, cost-benefit, and rationale.
- Risk deltas from proposed safeguards (showing before/after IR or F-N levels).
- Top 10 risk drivers with plain-English explanations.
- A Risk Matrix plot summarizing all scenarios to clearly show where the majority of the facility’s risks sit (e.g., Low, Medium, High).
Metrics, Criteria & Visuals:
- Risk Targets: Individual risk bands and Societal risk criteria (F-N curve regions), best visualized as “Risk Reduction Tiles” (e.g., “If we invest $X, risk drops by Y%”).
- ALARP Thresholds: Cost-benefit thresholds and disproportion factors, supported by a waterfall chart showing the risk reduction contribution of each safeguard.
- Siting & Boundaries: IR heatmap snapshots with clear receptors (schools, roads, housing) and boundaries labeled.
2) QRA for Project Managers & Design Engineers
In design, QRA is most powerful early. Small layout nudges—rotating equipment, increasing spacing, relocating an occupied building—can erase future headaches. IR contours over a plot plan expose where population and hazards collide. Contribution tables show which scenarios dominate, so you fix the real drivers, not the loudest ones. Sensitivity runs (e.g., seasonal winds, inventory swings, CFD for congestion) prevent surprises during regulatory review.
You’re deciding
- Plot plan/layout and separation distances
- Siting for occupied buildings, control rooms, and substations (OBRA)
- Whether to make a design change now or retrofit it later.
You need to see
- IR contours overlaying the site plan (1E-4, 1E-5, 1E-6 per year, as applicable country wise)
- Scenario contribution tables (which events dominate risk)
- Design sensitivity checks: The specific risk impact of relocating a hazard source or installing a protective barrier.
- Recommendations for advanced study: Flagging where high-risk contributors require specialized modeling (e.g., CFD for dispersion) beyond the base QRA scope.
- Escalation and domino pathways (e.g., vessel-to-pipe rack-to-tank)
Metrics & criteria
- Tolerability Limits: Regulatory or company-specific thresholds (e.g., IR ≤ 10⁻⁴/yr at the fence line).
- “Beyond Standard” Triggers: Determining if the risk profile requires safeguards that exceed typical design standards (e.g., API, NFPA, NORSOK).
- ALARP Justification: Documenting design measures not implemented based on Cost-Benefit Analysis (CBA).
3) QRA for PSM Leads & Operations
PSM leads own the living QRA and its governance. You curate the MAH register, maintain risk criteria, and align bow-ties, HAZOP, and LOPA with quantitative results. You document ALARP options, uncertainty, and sensitivity, and prepare audit-ready evidence for regulators and stakeholders. You coordinate updates at defined cadences and after material changes. You ensure data lineage from failure rates to consequence models remains transparent. You brief executives with decision-grade packs and drive barrier strategies site-wide.
You’re deciding:
- LOPA credits, SIL targets (with IEC 61511 alignment).
- MOC triggers: When a change requires an updated QRA.
- Factors used in the QRA: Determining the validity of key inputs, specifically:
- Frequencies: Adjusting event/fault tree leak frequencies as the plant ages.
- Probabilities: Amending conditional probabilities (ignition, escalation, fatality) where initial assumptions were too conservative and can be justified by operational data.
- Barriers: Validating barrier effectiveness and degradation assumptions.
- Operating envelopes, impairment planning, and emergency procedures.
You need to see:
- Ranked scenario list by frequency and consequence, with IPL performance
- Impairment deltas: risk uplift if a safeguard or SIF is offline
- “Top 5 to fix” list: practical procedural or mechanical integrity actions
Metrics & criteria:
- Tolerable frequency targets for initiating events
- PFDavg alignment with LOPA assumptions
- Alarm rates, bypass rules, proof-test intervals
4) QRA for Regulators & Authorities
Regulatory readers must see the hallmarks of good practice: clear IR contours with receptor definitions, societal risk F-N curves benchmarked against jurisdictional criteria, and a transparent ALARP demonstration that shows options considered and why.
The narrative should separate worst-credible from maximum imaginable, and it should disclose uncertainties rather than bury them. Because rules vary—COMAH/Seveso in the EU/UK, OSHA PSM and EPA RMP expectations in the US, MSIHC with PESO/OISD practices in India, HCIS in Saudi Arabia, SCDF MHI in Singapore—the QRA should cite the relevant criteria and stick to them.
You’re deciding:
- Land-use planning and licensing
- Compliance with jurisdictional risk criteria and guidance
- Conditions for operation and change management
You need to see:
- Societal risk F-N curves with uncertainty bands and referenced criteria
- Clear IR contours with receptor definitions and mapping detail
- Documented ALARP options analysis: what you considered, why you chose
- Land use impact radius (radiation, overpressure, toxicity)
Regional notes
- US: Alignment with OSHA PSM and EPA RMP offsite consequence analysis; use QRA to go beyond OCA for siting and ALARP demonstration
- EU/UK: Seveso III/COMAH emphasis on tolerability and explicit ALARP with cost-benefit
- India: MSIHC Rules, PESO/OISD practices; increasing focus on OBRA and land-use planning around MAH units
- Middle East / SEA: Saudi HCIS documentation depth; Singapore SCDF MHI QRA guidelines with defined societal risk criteria
5) QRA for Insurers & Underwriters
Insurers read QRAs through the lens of loss and reliability. Exceedance curves—how often losses exceed a given amount—translate seamlessly into pricing and coverage. They want to see what drives the tail of the distribution: domino sequences, tight congested layouts, single-point failures, and seasonal vulnerabilities.
You’re deciding:
- Premiums, deductibles, and coverage terms
- Business interruption exposure and Maximum Foreseeable Loss
- Focused engineering surveys for loss prevention
You need to see:
- Exceedance curves (loss vs. annual frequency)
- Maximum Credible Event (MCE) frequency
- Damage area or asset value at risk
Metrics & criteria:
- Risk normalized per throughput or per storage volume
- Time to containment and effectiveness of emergency response
6) QRA for Emergency Response & Municipal Planning
Emergency planners don’t need a dissertation on dispersion algorithms. They need maps with plain captions: “Shelter in place is safest inside this zone; evacuation route A is preferred under north-easterly winds.”
Toxic load isopleths, thermal radiation footprints, and egress time comparisons turn into dispatchable actions only when the words are simple. The most useful models anticipate night-time stability classes, blocked intersections, and real-world delays. A small but vital output is a publishable community map and a two-minute script for drill briefings.
You’re deciding
- Emergency Planning Zones (EPZs), evacuation routes, and shelter-in-place policy
- Mutual-aid agreements and resource allocation (foam, water, medical)
- Community notification triggers
You need to see
- Toxic load isopleths, thermal radiation footprints, and overpressure contours
- Egress time estimates vs. consequence arrival times
- Impact under prevailing winds and at night-time stability classes
Metrics & criteria
- Toxic dose thresholds (e.g., AEGL/ERPG – Acute Exposure Guideline Levels/Emergency Response Planning Guidelines) and probabilistic wind roses
- Minimum separation distances for assembly points and staging areas.
7) QRA for Investors & Lenders
Capital providers are less interested in the ninth decimal of frequency than in direction and control: Are risks in the acceptable or ALARP region? What concrete projects pull them down further? How does risk normalize across units or assets—per ton processed, per dollar revenue?
A good QRA summary for finance shows trendlines before/after investments and names the governance that keeps numbers honest: competent personnel, change control, proof testing, and third-party review.
You’re deciding:
- Financing terms, covenants, and ESG risk scores
- Portfolio exposure to low-probability/high-consequence events
- Prioritization of risk-reduction CapEx (Capital Expenditures).
You need to see:
- Risk Benchmarking: A comparison of risk levels against similar facilities or industry standards to contextualize performance.
- Trendlines: Risk reduction before/after specific projects (credible risk delta).
- Governance Assurance: Evidence that competency, change control, and maintenance underpin the numbers.
Metrics & criteria:
- Movement out of intolerable regions; ALARP documentation
- Third-party review or verification of evidence
8) QRA for Communities & Public Stakeholders
Neighbors don’t need F-N curves; they need respect and clarity. A QRA can empower communities when it’s translated into a friendly leaflet: a simple map,
“what you’ll hear/see,” and clear steps—go indoors, shut windows, wait for SMS instructions; evacuation siren means use Route B to Assembly Point C.
Pair this with a short explanation of safeguards and drills so people understand the effort behind the scenes. Trust grows when information is local, human, and consistent. A little time spent crafting that public version of the QRA pays off every day you don’t have an incident—and especially on the day you do.
You’re deciding
- Whether to trust the facility and participate in preparedness
- How to act during an incident (evacuate or shelter)
You need to see
- Plain-language summaries with clear maps and simple instructions
- How the company reduces risk: design, safeguards, drills, community alerts
- Contact points and notification systems.
Metrics & criteria
- None needed in technical terms—translate thresholds into actions:
“If you hear the siren and smell gas, go indoors, close windows, follow SMS instructions.”
How to Present QRA
Effective presentation starts with early engagement. During the draft phase, identify which stakeholders are relevant for this specific QRA—it may be all of them or just a subset. Engage them early to confirm exactly what data they require to support their decisions.
Once the audience is defined, format the QRA so each group acts fast:
- Executives get a one-page options matrix showing cost per PLL averted and residual risk against criteria.
- Managers see plot-plan overlays and staffing or egress guidance.
- Operators receive three clear triggers and simple response steps.
- Maintenance gets tag-level risk contribution lists.
- I&C sees LOPA linkage and SIL targets.
- Regulators and Insurers receive criteria tables, ALARP files, and uncertainty bounds.
Conclusion
QRA isn’t a report you file—it’s a decision engine. When it’s framed around who needs to act (executives, designers, PSM/ops, regulators, insurers, emergency planners, investors, communities), the analysis stops being a stack of IR contours and becomes a living thread that ties design choices, operating discipline, and public trust to ALARP, every day.
With clear assumptions, defensible data, uncertainty shown (not hidden), and outputs matched to each audience, QRA moves from compliance to competitive advantage—and it proves its worth the moment priorities, layouts, or safeguards change.