The development of a quantitative risk assessment (QRA) study is an important pre-requisite of any oil and gas facility. Thong Wee Jun and Rachael Tee, Senior Engineers with Malaysia-based Synergen, explain why these should be integrated between multiple facilities located in the same industrial area to provide a more accurate representation of risk exposure.
Worldwide, onshore oil and gas processing and petrochemical complexes typically consist of multiple facilities, managed more or less independently by individual stakeholders, with the exception of key interfaces where products from one plant may serve as feedstock for another plant. An important pre-requisite of any oil and gas or petrochemical facility is the development of a quantitative risk assessment (QRA), which establishes the risk exposure of personnel located within facility as well as the surrounding general populace due to potential hazardous events arising from the facility. However, this approach typically only focuses on assessment of risks arising from the facility being assessed in isolation, without taking into account potential external risks arising from neighbouring facilities.
Integrated risk management between multiple facilities located within the same industrial area is often neglected as it would typically involve several interfaces across various stakeholders. Lessons learnt from past industrial accidents have clearly demonstrated that onshore industrial incidents are rarely, if ever, confined to the boundaries of the originating facility. A prime example of this is the Buncefield incident which occurred in December 2005 in Hemel Hempstead, Hertfordshire, UK, close to Junction 8 of the M1 motorway. In this incident, the overflow of a gasoline tank led to the formation of a huge vapour cloud explosion, causing over 40 reported personnel injuries as well as damage to surrounding commercial and residential properties (Source: COMAH – Buncefield Incident, UK HSE).
The danger with assessing risks for separate facilities in isolation is twofold – not only are the risk levels within the areas of overlapping risk exposure underrepresented, but also the potential to trigger a chain reaction wherein an incident from one facility may escalate to a neighbouring facility goes unrecognised (the so-called ‘domino’ effect). One of the best solutions is to undertake an integrated risk assessment that aims to amalgamate multiple disparate facilities’ risk profiles into a single seamless profile, thereby providing a more accurate representation of risk levels within the area.
An accurate understanding of the risk profile would allow for improved joint risk management strategies to be established. This would include prioritisation of hazard management strategies through the implementation of suitable controls and procedures, as well as the co-ordination of emergency response measures to maximise effectiveness. It should be noted that the integration of risk contours across multiple facilities requires the sharing of information/risk assessments from the facilities involved in the form of location specific individual risk (LSIR).
Location specific individual risk The LSIR is a key measure of risk adopted for oil and gas processing and petrochemical facilities.
It is defined as the continuous personnel risk exposure at a particular location on the facility for the whole year, and can be represented by the following
Equation 1: LSIR = ∑ Hazadous event frequency x Fatality probility in the location
Hazadous events
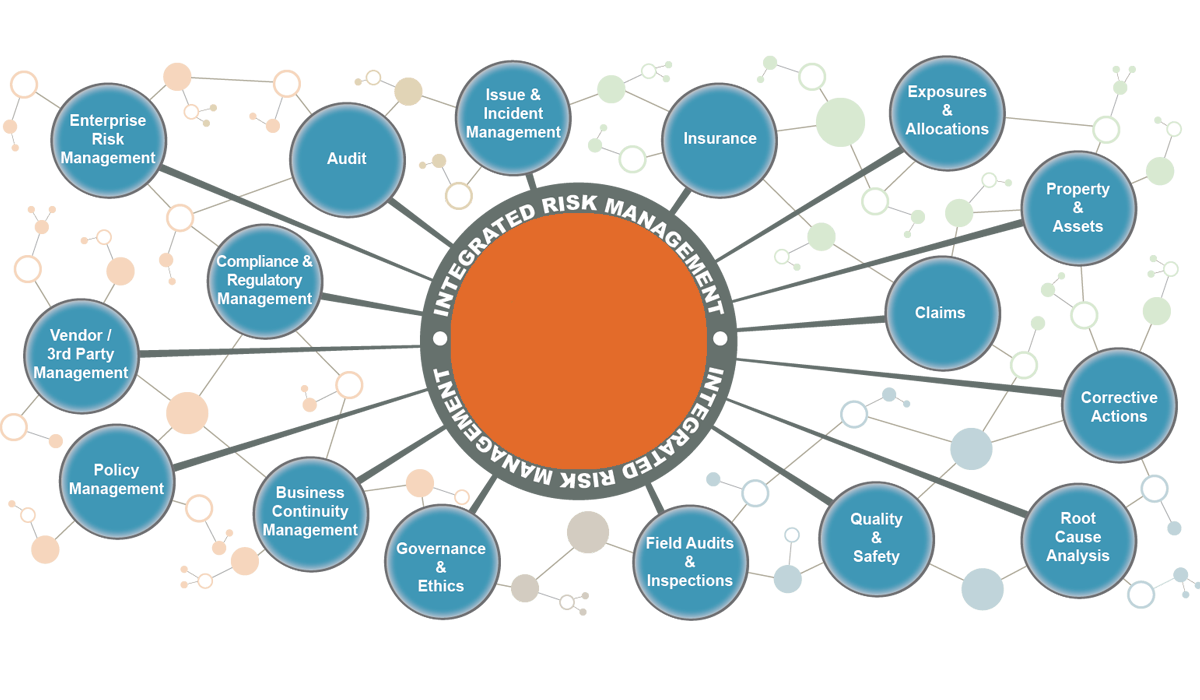
Areas with higher relative LSIR levels would naturally be defined as being more dangerous. LSIR can be visually depicted in the form of iso-risk contours, which are contour lines plotted through specific locations having a given
LSIR level. As illustrated in Figure 1, point A can clearly be visualised as having comparatively higher risk levels than point B.
LSIR, by definition is a summation of the risk contributions of all hazard events for a given location, and allows us to sum up the risks from all contributors (both internally within the facility and also externally from neighbouring sources) as defined by
Equation 2:Total LSIR =LSIR (from within facility) + ∑neighbouring facilities LSIR
In reality
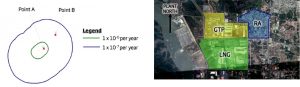
A case study based on a recent project undertaken by Synergen on the amalgamation of iso-risk contours between two onshore plants located adjacent to one another into a single iso-risk contour provides a useful explanation. Figure 2 shows a geographical view of the gas treatment plant (GTP) and LNG plant considered in the case study. ‘RA’ represents the residential area adjacent to these plants. Each of these plants had independent safety management systems, managed by different stakeholders, and separate QRAs. Iso-risk contours were produced for each plant.
The amalgamation process started with a gap analysis between the separate QRA studies in order to identify any methodology discrepancies in terms of study assumptions, incident frequencies and also modelling of hazard consequences (thermal radiation contours, explosion overpressures, etc). Alignment of the methodology is critical to ensure that risk levels remain proportional upon summation of the risks from the individual facilities.
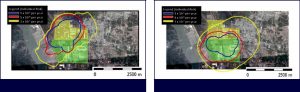
The next step was to regenerate the risk contours for the GTP and LNG, as depicted in Figures 3 and 4, based on data extracted from the original QRAs. For this case study, TNO risk curve software was used (although any equivalent iso-risk contour plotting software could have been used). These figures clearly demonstrate that the risk contours from each facility extend well beyond the boundaries of their respective facilities, meaning there would be the potential for cross-escalation from one plant onto another and vice versa. It is also worth noting that both contours impinge at least partially upon the aforementioned residential area. In other words, reviewing the results from each QRA in isolation would result in an under-representation of risk levels at the residential area. These figures were compared against iso-risk contours presented in original QRAs to ensure consistency.
The iso-risk contour acceptance criteria adopted in this case study were specific to the local authority requirements as detailed below:
• The 1 x 10⁻⁵ per year individual risk contour should not extend beyond industrial development.
• The 1 x 10⁻⁶ per year individual risk contour should not encompass involuntary recipients of industrial risks such as residential areas, schools, hospitals and places of continuous occupancy, etc.
• The 3 x 10⁻⁷ per year individual risk contour should not extend beyond the football ground and large hospitals.
The final step involved the integration of risk contours by modelling both iso-risk contours from both the GTP and LNG simultaneously, generating the integrated plot as shown in Figure 5.
From the study results shown in Figure 5, the residential area located east of the GTP was found to be within the iso-risk contour of 1.0E-06, thereby exceeding the typical allowable risk levels for such areas. The exposure of residential areas to potential higher risk levels necessitated a detailed review on their location
with respect to potential plant incidents as well as for facility duty holders to undertake community relations to inform offsite population of such risks.
In addition, several hazard scenarios arising from the individual plants were also found to have the potential to cause cross impairment, whereby escalation from either plant could affect critical safety systems/buildings within adjacent plant. These scenarios were found to arise from systems having relatively high operating pressures or located within close proximity to the boundary between the two facilities.
One potential measure to reduce cross-escalation risks would be to ensure the incident response procedures for releases from identified high risk systems includes promptly communicating the occurrence to neighbouring facilities. Another potential risk reduction measure would be the provision of line-of-sight gas detectors at the plant boundary between both facilities, to provide warning of interplant hazard migration.
The integrated contours are also beneficial for identification of combined safe areas for personnel to muster in the event of a hazard incident. The ideal location for mustering should be a balance between being close enough to the facility in question for personnel to reach within a reasonable duration, but also far enough that personnel mustering would not be exposed to unduly high risk levels. The recommended locations for combined muster areas proposed in this case study is depicted in Figure 6.
Accurate representation of risk In a nutshell, the integrated risk contour approach is an appealing prospect from a process safety standpoint, providing a more accurate representation of risk exposure not only for personnel within oil and gas facilities but also the general populace residing within the vicinity. Increased clarity in risk levels would benefit duty holders when defining appropriate risk reduction measures, and also emergency response procedures. Such understanding can only increase in importance in line with the growing number and complexity of oil and gas and petrochemical sites, coupled with the trend of residential areas being built closer and closer to these sites.
EI Malaysia branch
The Energy Institute’s Malaysia branch is very active, with a full programme of speaker meetings and site visits. It is also developing a nationwide network of EI student groups.
Potential members are very much encouraged to join, and can currently due so online at a 50% reduced rate.
For more information on how to join, as well as details of past and future events.