| Summary: Quantitative Risk Assessment (QRA) is a structured, data-driven method that estimates how often hazardous events could happen and how severe their consequences could be. By combining frequency analysis with consequence modeling, QRA quantifies individual and societal risk to guide ALARP decisions, safeguard design, emergency planning, and regulatory compliance. |
What Is QRA?
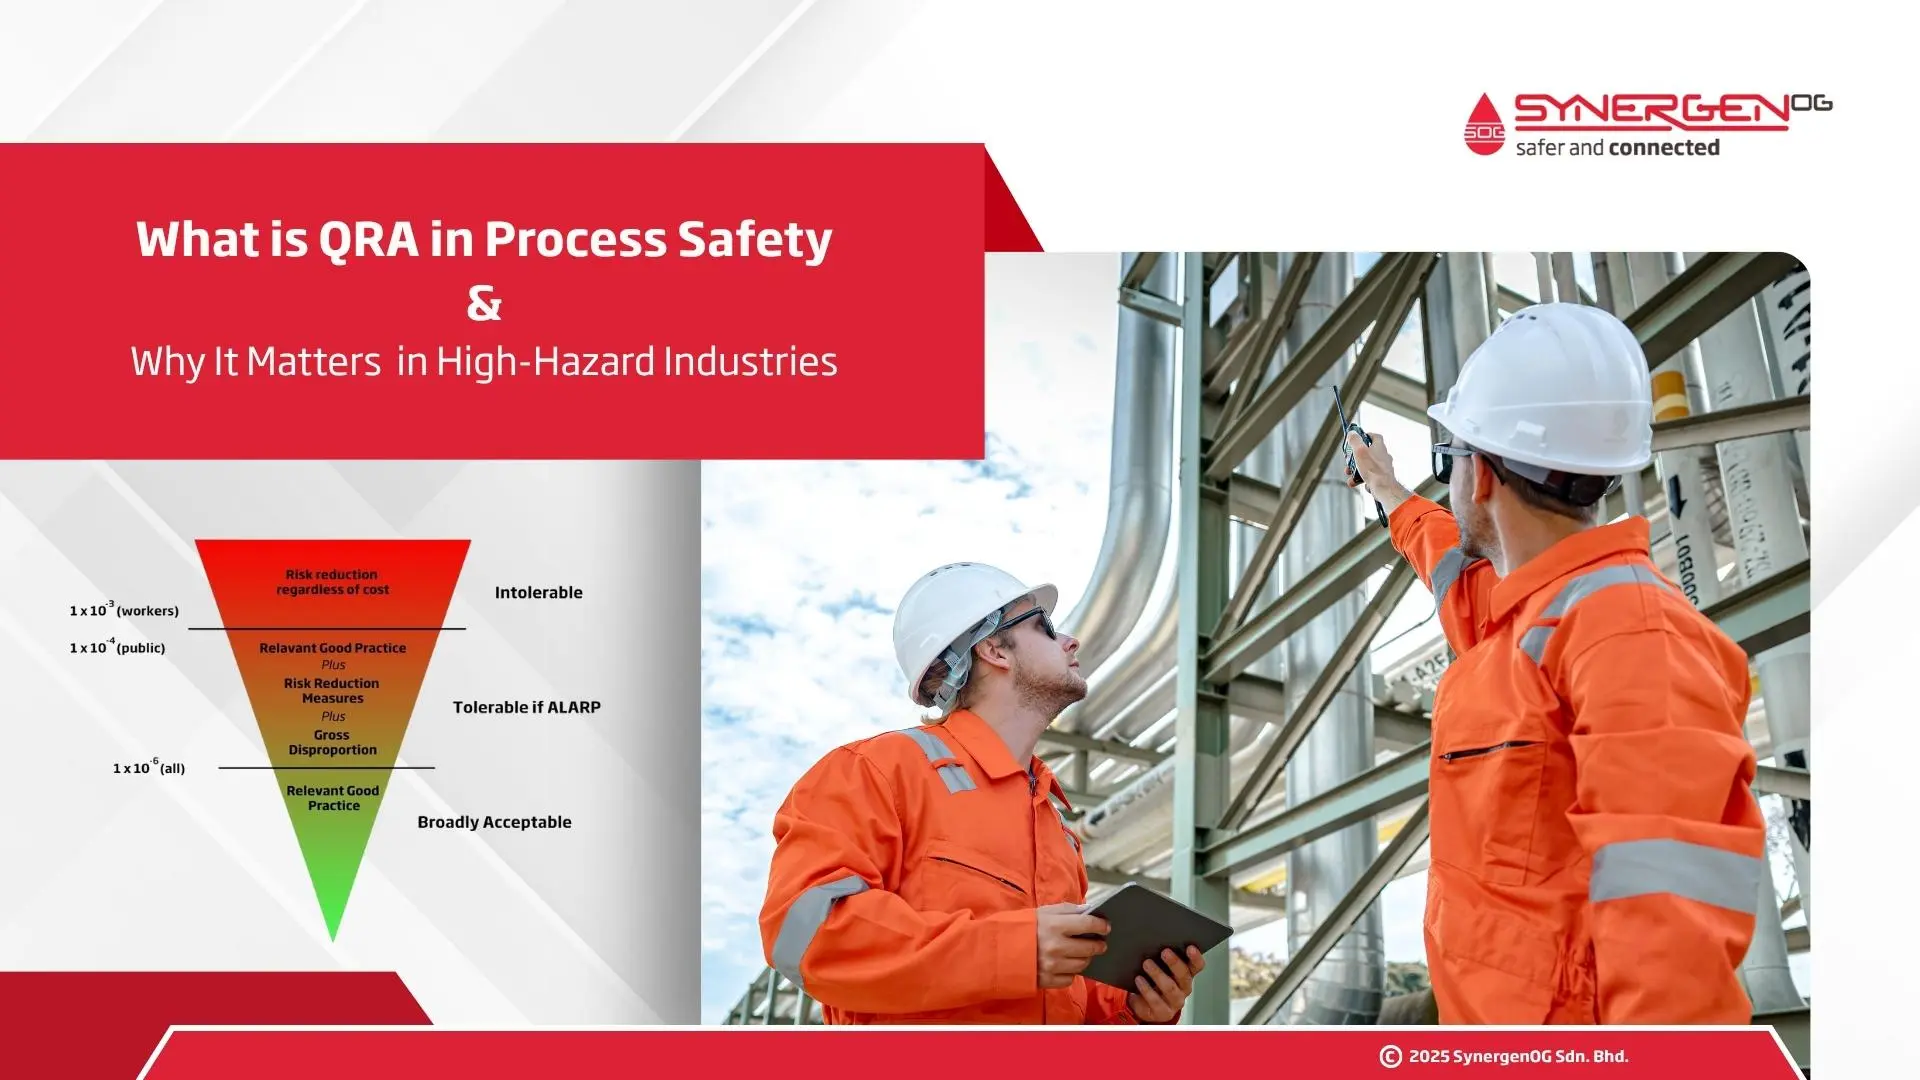
If you’ve ever asked “What is QRA?”, here’s the practical answer: Quantitative Risk Assessment is the process of estimating the frequency of hazardous events (loss of containment, fire, explosion, toxic release) and calculating their consequences to quantify risk to people, assets, the environment, and business continuity. Unlike a qualitative risk matrix, QRA translates complex hazards into numbers—for example, individual risk (IR) at a location or societal risk (SR) for groups—so leaders can compare risk to tolerability criteria and justify ALARP (as low as reasonably practicable) decisions.
Typical QRA modeling components include event trees, fault trees, ignition probabilities, consequence modeling for toxic dispersion, thermal radiation, overpressure, fatality probabilities, and sometimes environmental and business loss modeling. Its scope often covers land-use planning, occupied building risk assessment (OBRA), emergency shutdown (ESD) strategies, and SIF/SIL implications under IEC 61511.
Why QRA Is Critical in High-Hazard Industries
In refining, petrochemicals, LNG, gas storage, pipelines, hydrogen, mining & minerals, pharma solvents, and power, decisions carry major accident hazard (MAH) stakes.
QRA helps you:
- Prioritize safeguards by risk-reduction impact (compare passive fire protection, detection/suppression, SIF/SIL, ESD, inventory limits).
- Support siting/layout/Government land use planning: tank spacing, process/utility separation, occupied building location, muster points, access/egress routes.
- Demonstrate compliance and license to operate under OSHA PSM, EPA RMP, Seveso III/COMAH risk demonstration requirements, and company risk tolerability criteria.
- Optimize CAPEX/OPEX using ALARP: spend where the risk reduction per dollar is highest.
- Strengthen emergency planning with zones, IR contour overlays, scenario-specific isolation and response times.
In short, QRA turns uncertainty into defensible choices, enabling transparent trade-offs when balancing productivity, safety, cost, and community expectations.
How QRA Works: Step-by-Step
The QRA workflow
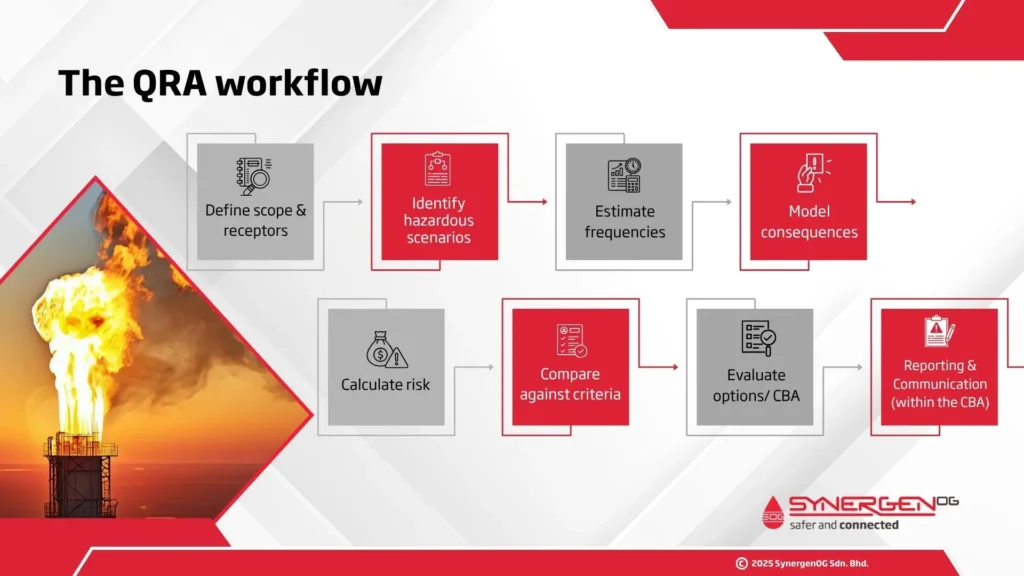
- Define scope & receptors: site boundaries, nearby populations, critical buildings, metrics (IR, SR).
- Identify hazardous scenarios: from HAZID/HAZOP, incident history, bow-ties, inventories, escalation paths.
- Estimate frequencies: initiating event rates (failure data), human error, common cause failures, demand rates for protections.
- Model consequences: dispersion, thermal radiation, overpressure, dose/probit calculations, weather classes, terrain/obstacles.
- Calculate risk: combine frequency × consequence → IR contours and F–N curves.
- Compare against criteria: corporate and/or regulatory risk tolerability criteria, ALARP regions and sometimes involve identify major dominant risk scenarios – to be fed into ERP planning.
- Evaluate options/ CBA: Within a QRA, a Cost–Benefit Assessment (CBA) provides a structured approach to evaluate potential risk reduction measures and determine whether their implementation is reasonably practicable. This process involves identifying and assessing various options — such as inherently safer design, SIF/SIL implementation, detection and suppression systems, spacing optimization, and land-use planning controls — to establish whether the additional cost of each measure is proportionate to the reduction in risk achieved. The outcome supports the ALARP (As Low As Reasonably Practicable) demonstration, and it answers the question “Is the additional cost proportionate to the reduction in risk achieved?”
- Reporting & Communication (within the CBA):
Present decision-ready outputs: concise visuals (risk profiles, dominant-contributor Pareto), key uncertainty/sensitivity results, and a clear ALARP justification—ending with a brief action plan (owner, timeline, cost, expected risk reduction).
Techniques & tools: event/fault trees, consequence models (jet/pool fires, VCE, BLEVE, toxics), and OBRA methods are standard across the literature and practice.
Risk Criteria: Individual vs. Societal
- Individual Risk (IR): Annual probability that a hypothetical, continuously present individual at a location becomes a fatality due to site hazards; results are shown as IR contours over plot plans and surroundings. Jurisdictions set their own thresholds (e.g., Singapore publishes explicit IR criteria and contour values for land-use decisions).
- Societal Risk (SR): F–N curves plot the frequency (F) of events causing N or more fatalities; UKHSE R2P2, Purple book, Hong Kong – Risk Guidelines (EIAO-TM), Singapore MHI guidelines and other country specific sources illustrate typical formats and risk-aversion slopes.
Inputs, Data Quality & Uncertainty
High-quality inputs make or break your QRA. Expect a data collection phase covering process and layout data, inventories and states, population/occupancy, meteorology, failure/ignition data, and historical learnings; CCPS guidelines and the Netherlands “Purple Book” remain core references for methods and data framing.
Thermal radiation/overpressure endpoints are commonly drawn from HSE/CCPS and related guidance (e.g., 5 / 12.5 / 37.5 kW·m⁻² rules of thumb for personnel/equipment). Always state endpoint choices and limitations.
Uncertainty & sensitivity: capture parameter ranges (hole sizes, ignition delays), model uncertainty (dose/probit, thermal/overpressure endpoints), and scenario completeness; run sensitivities to show robustness before ALARP decisions.
Typical Inputs and Notes Table
| Input | Typical Source | Sensitivity Note |
| Equipment failure rates | Industry databases & site CMMS (Computerized Maintenance Management Systems) | Match duty, fluid, maintenance, environment |
| Ignition probability | Literature & expert judgment | Strong driver for fire/explosion consequences |
| Meteorological data | Site weather file | Stability class & wind speed steer dispersion |
| Hole size distribution | Engineering judgment & data | Drives toxic/flammable release impact |
| Occupancy profiles | HR/Operations | Time-of-day/week variance matters |
| Safeguard reliability (SIF) | IEC 61511 SIL verification | Test intervals & proof test coverage critical |
What You Get from a QRA (Outputs & Use)
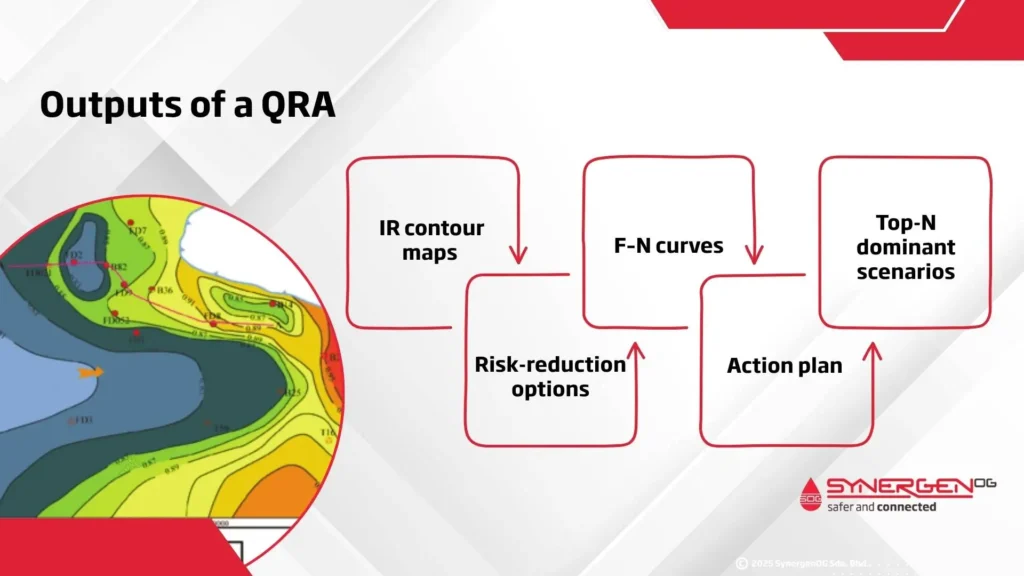
- IR contour maps across the site and into surrounding areas (contours per jurisdictional criteria; e.g., Singapore publishes specific IR bands for planning).
- F–N curves against company or regulatory societal risk criteria (examples and formats appear in NFPA 59A-linked literature and HSE policy notes
- Top-N dominant scenarios (Pareto) to focus mitigations.
- Risk-reduction options with cost vs. risk and ALARP
- Action plan with traceable recommendations.
Common Mistakes and How to Avoid Them
- Treating QRA as a one-off compliance exercise → integrate with MOC and periodic safety report/PHA
Copy-pasting generic failure data → calibrate to local duty/materials and use recognized methodologies (e.g., Purple Book, CCPS) - Ignoring human/organizational factors → CCPS/EI guidance emphasizes barrier effectiveness and human error.
QRA for Whom
Stakeholder Primary Use of QRA – Typical Decisions / Applications
QRA aligns diverse stakeholders by translating hazard, frequency, and consequence data into decision-quality risk metrics.
Stakeholders in QRA span everyone who makes, influences, executes, or is affected by risk decisions—operators, engineers, regulators, executives, HSE, maintenance, responders, contractors, communities, and insurers—to ensure hazards are identified, controls are effective, and residual risk is understood and accepted.
- Operators / Facility Owners Establish overall facility risk profile and demonstrate ALARP compliance. – Understand key risk drivers and vulnerable areas. – Prioritize upgrades or risk reduction projects. – Support ALARP demonstration to authorities.
- Design & Process Engineers Integrate risk insights into facility layout, design, and system configuration. – Optimize layout to reduce escalation potential. – Size fire/blast protection and separation distances. – Set design accidental load cases (fire/explosion).
- HSE & Risk Management Teams Benchmark, monitor, and manage operational risk levels. – Develop risk registers and KPIs. – Identify and track risk reduction measures. – Support Safety Case and COMAH submissions.
- Executives & Management Strategic decision-making and assurance that risk levels are acceptable. – Balance safety investment vs. business risk. – Communicate ALARP demonstration to board and shareholders. Justify expenditures using Cost–Benefit Assessments (CBA).
- Regulators & Authorities Verify compliance with safety legislation and tolerability criteria. – Assess safety submissions (e.g., Safety Case, EIA, MHI licensing). – Ensure societal and individual risks meet national criteria (FN curves, IR contours).
- Emergency Responders (Onsite & Offsite) Provide quantitative input to emergency response planning and drills. – Define credible worst-case scenarios and event escalation timelines. – Plan response zones and resource allocation (e.g., firewater, evacuation).
- Contractors & EPCs Guide design and construction phase safety planning. – Ensure temporary operations (commissioning, construction) stay within risk tolerances. – Align design deliverables (layout, venting, PFP) with risk outcomes.
- Local Communities / Public Stakeholders Transparency and assurance regarding external safety. – Understand societal risk levels (FN curve). – Assess land-use compatibility and public safety distance compliance. – Support community engagement and consultation.
- Insurers / Underwriters Quantitative understanding of loss potential and exposure. – Evaluate potential loss of life and asset damage. – Determine insurance premiums and coverage conditions. – Assess business interruption risk scenarios.
When to Update a QRA
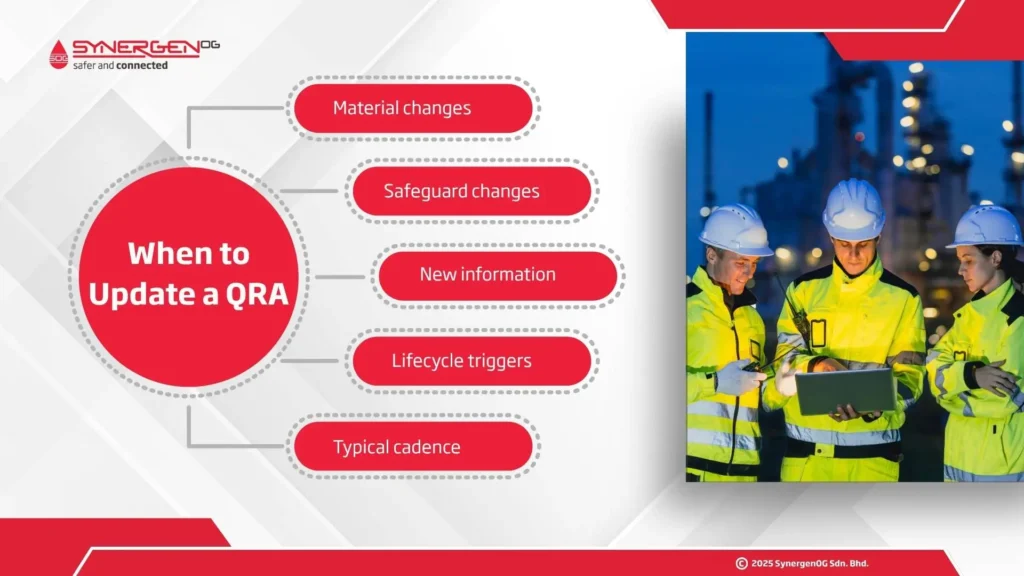
- Material changes: new units, inventory/throughput increases, layout changes, feed/product changes.
- Safeguard changes: SIS proof-test intervals, SIL re-verification, added/removed protections.
- New information: incident learnings, updated failure rate data, meteorology/population changes.
- Lifecycle triggers: pre-startup, Management of Change (MOC), expansion, and decommissioning.
- Typical cadence: align with regulatory cycles—COMAH/Seveso safety report reviews every 5 years and OSHA PSM PHA revalidation every 5 years (for US sites).
Key Takeaways
- QRA is a structured, data-driven method that quantifies the frequency and consequences of hazardous events (e.g., fire, explosion, toxic release).
- It provides numerical risk metrics—Individual Risk (IR) and Societal Risk (SR)—to support ALARP, design, emergency planning, and regulatory compliance.
- Applied across all project stages: concept, FEED, detailed design, pre-startup, operations, MOC, and decommissioning.
- QRA supports critical safety and business decisions in high-hazard industries such as oil & gas, LNG, petrochemical, hydrogen, and mining. Key uses include:
- Safeguard prioritization (PFP, ESD, SIF/SIL, inventory limits).
- Facility layout and siting (spacing, occupied buildings, muster points).
- Regulatory compliance (OSHA PSM, EPA RMP, Seveso III / COMAH).
- Emergency planning (response zones, evacuation, isolation).
- Cost–benefit optimization for ALARP.
- Common Pitfalls
- Treating QRA as a one-time compliance deliverable rather than a living analysis updated under MOC.
- Using generic failure data without calibration.
- Ignoring human and organizational factors.
- Overconfidence in uncertain data without sensitivity analysis.
- Lack of alignment with HAZOP/LOPA/bow-tie
- QRA provides a common quantitative language of risk for diverse stakeholders
- Keep it live: update with MOC and changing data; sync with 5-year review/revalidation expectations.