
| Summary: How to determine the SIL of a particular SIF function? What are the SIL determination methods available? This article aims to explore and evaluate various methods for determining the appropriate Safety Integrity Level (SIL) for safety instrumented functions (SIFs) in industrial processes. Going deep into the structured approaches such as Risk Graphs, Layer of Protection Analysis (LOPA), and Fault Tree Analysis (FTA), providing insights into their methodologies. |
What Is SIL Determination Study?
A SIL Determination study is a critical risk assessment method used to evaluate if Safety Integrity Level (SIL) requirements are necessary for Safety Instrumented Functions (SIFs). The process involves:
- Assessing the likely occurrence and impact of an undesirable event that triggers a particular hazard;
- Calculating the risk reduction achieved through existing protective measures and identifying any residual risk;
- Assigning the appropriate SIL requirements for SIFs to bridge any risk discrepancies, in compliance with standards such as IEC 61508 or sector-specific standards like IEC 61511.
Step-by-Step Procedure of SIL Determination (The SIL Assessment Process)
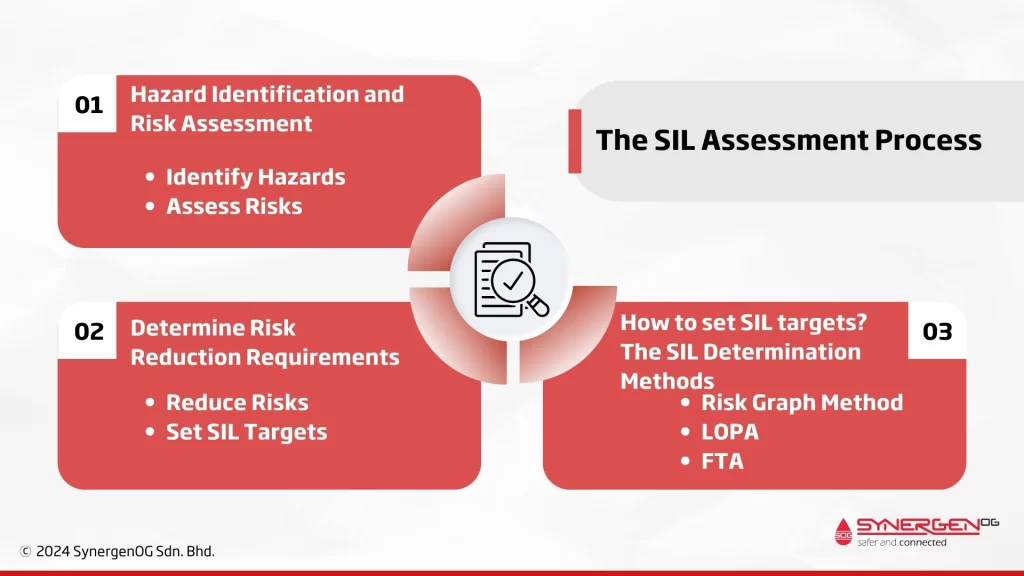
The Safety Integrity Level (SIL) assessment process is a systematic approach used to determine the level of safety integrity required for safety instrumented functions (SIFs) in industrial systems. This process ensures that the risk associated with hazardous events is reduced to an acceptable level. Here is a detailed step-by-step procedure for conducting a SIL assessment.
1. Hazard Identification and Risk Assessment
Identify Hazards: The first step involves identifying potential hazards in the process or system. This can be done using techniques such as Hazard and Operability Study (HAZOP), Failure Modes and Effects Analysis (FMEA), or Preliminary Hazard Analysis.
Assess Risks: Evaluate the risk associated with each identified hazard. Determine the severity of potential consequences and the likelihood of occurrences. For this purpose, tools like risk matrices or risk graphs are used.
2. Determine Risk Reduction Requirements
Reduce Risks: Based on the risk assessment, determine the amount of risk reduction required to bring the risk to an acceptable level. Compare the existing risk level with the acceptable risk criteria set by the organization.
Set SIL Targets: After determining the required risk reduction, you need to define the appropriate Safety Integrity Level (SIL) for each Safety Instrumented Function (SIF). The target SIL is essentially a benchmark that indicates how robust a safety system needs to be to manage identified risks effectively.
Read: SIL Classification Levels
3. How to set SIL targets? The SIL Determination Methods
SIF SIL targets are determined by using different SIL determination methods.
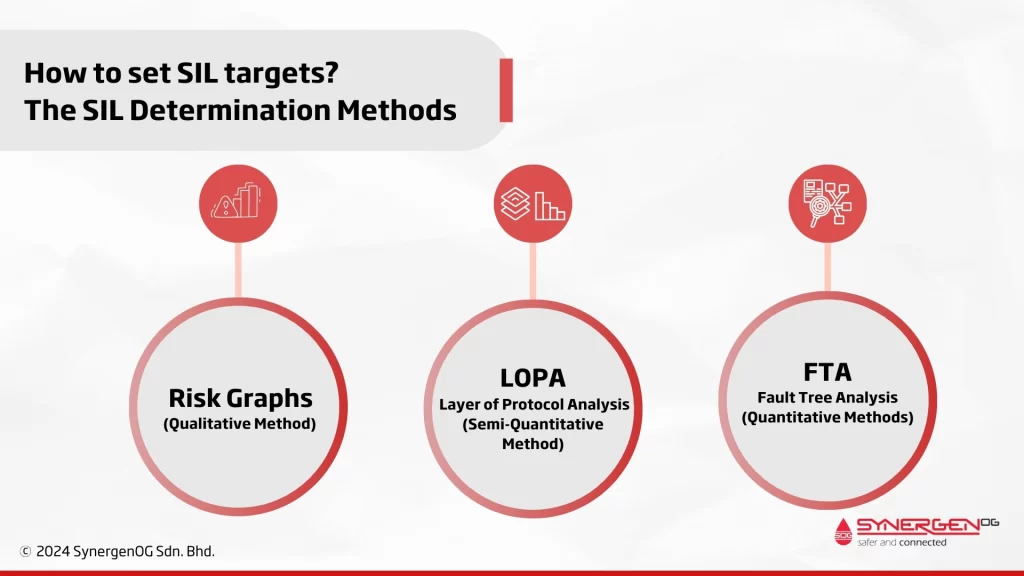
➢ Risk Graphs (Qualitative Method)
Use methods such as Risk Graphs for an initial screening of safety functions. Risk graphs help determine the SIL by evaluating factors such as consequence severity, frequency of exposure, the possibility of avoiding the hazard, and the probability of the unwanted occurrence.
Risk graphs consider four primary factors,
- Consequence Severity (C): This factor evaluates the potential impact of a hazardous event on people, the environment, and the system. Consequences are typically categorized as minor, significant, major, or catastrophic.
- Frequency of Exposure (F): This factor assesses how often people, equipment, or the environment are exposed to the hazard. Categories range from rare exposure to continuous exposure.
- Possibility of Avoidance (P): This factor considers the likelihood that the hazardous event can be avoided or mitigated if it occurs. Categories include impossible, rarely possible, and easily avoidable.
- Probability of Occurrence (W): This factor evaluates the likelihood that the hazardous event will occur. Categories can range from very unlikely to highly likely.
Also Read: Qualitative Vs Quantitative Risk Assessment
Process of Using Risk Graphs for SIL Determination
Identify and Categorize Risk Factors: For each safety function, identify and categorize the relevant risk factors (consequence severity, frequency of exposure, possibility of avoidance, and probability of occurrence).
Assign Categories to Risk Factors: Assign a specific category to each risk factor based on the characteristics of the hazardous event. For example:
- Consequence Severity (C): Moderate (SA), Serious (SB), Very Serious (SC), Catastrophic (SD), Disastrous (SE)
- Occupancy (F): High Occupancy (FA), Low Occupancy (FB)
- Possibility of Avoidance (P): High Avoidance (PA), Low Avoidance (PB)
- Demand Rate (W): Rare (W0), Low (W1), Medium (W2), High (W3), Frequent (W4)
Plot the Risk Factors on the Graph: Using the assigned categories, plot the risk factors on the risk graph. The risk graph is typically a matrix with consequence severity on one axis and a combination of occupancy, possibility of avoidance, and demand rate on the other axis.
Determine the Intersection Point: The intersection point of the plotted categories on the risk graph indicates the required SIL. Each intersection point corresponds to a specific SIL level, from SIL 1 to SIL 4.
Example of a Risk Graph
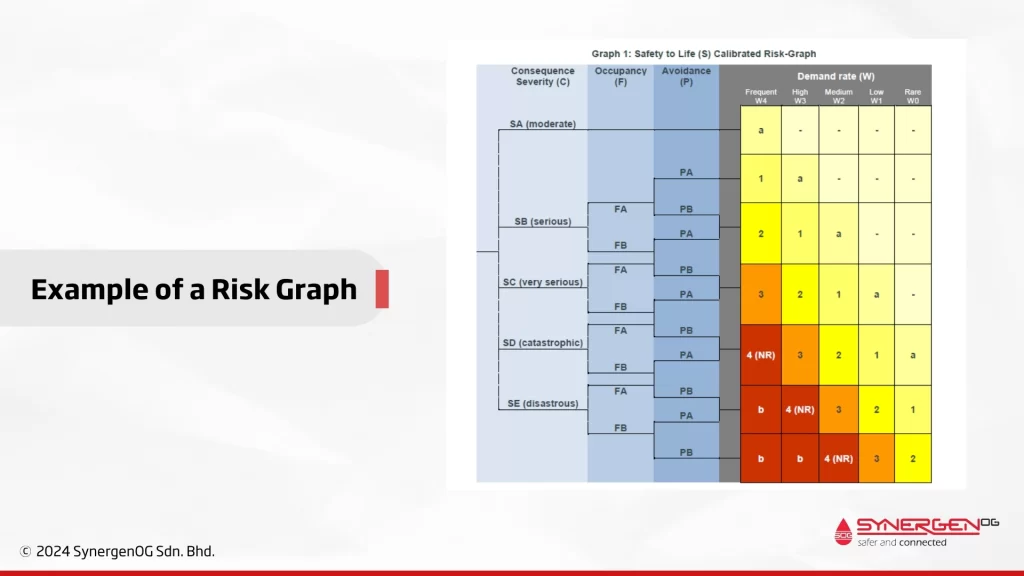
Risk graphs serve as a valuable tool in the initial stages of SIL determination by providing a structured approach to evaluate and categorize risk factors. While they offer simplicity and efficiency, it is essential to complement them with more detailed quantitative methods, such as Layer of Protection Analysis (LOPA) or Fault Tree Analysis (FTA), for comprehensive SIL assessment and verification.
➢ LOPA – Layer of Protocol Analysis (Semi-Quantitative Method)
LOPA offers a more detailed and accurate assessment compared to qualitative methods and it is the most common method for SIL determination. This method involves identifying initiating events, intermediate events, and independent protection layers (IPLs). The cumulative effect of all IPLs is evaluated to determine if additional risk reduction is needed, and thereby establish the target SIL.
The components of LOPA assessment are,
- Initiating Events (IE): These are events that can lead to hazardous situations. Initiating events can include equipment failures, human errors, or external events like natural disasters.
- Intermediate Events: These are sequences of events that occur between the initiating event and the hazardous outcome. They are critical in understanding how a hazard propagates.
- Independent Protection Layers (IPLs): These are safeguards that prevent the propagation of an initiating event to a hazardous outcome. Each IPL must be independent of the initiating event and other protection layers. Examples of IPLs include relief valves, alarms, automatic shutdown systems, and operator intervention.
- Consequence Severity (C): This measures the potential impact of a hazardous event in terms of safety, environmental damage, or financial loss. Consequences are categorized based on severity, from minor to catastrophic.
- Frequency of Initiating Event (FIE): This quantifies how often the initiating event occurs. It is usually expressed in events per year.
- Probability of Failure on Demand (PFD): This measures the likelihood that an IPL will fail to perform its intended function when required. PFD is a critical factor in evaluating the effectiveness of each IPL.
LOPA Analysis Steps of SIL Determination for a Specific SIF Function
Step 1 -> Identify Hazard Scenarios: Begin by identifying potential hazard scenarios that could result in significant consequences. These are LOC (Loss of Containment) scenarios usually derived from the HAZOP study. This involves understanding the process and identifying initiating events that can lead to hazardous outcomes.
Step 2 -> Set the Target Risk Level: Defining the target risk level (i.e. what is the level of risk at which the SIF can tolerate the hazard identified in Step 1) using risk matrix and risk tolerability frameworks.
Ex: If the hazard is someone getting a bruised shin is, it may be allowed 1 in a year risk level. But if the hazard is complete destruction of a facility and surrounding homes – this may be once a million-risk level being tolerated.
Step 3-> Analyze Initiating Events: Determine the frequency of each initiating event (cause). This requires historical data, process knowledge, and expert judgment.
Step 4 -> List Independent Protection Layers: Identify and list all existing IPLs for each hazard scenario. Ensure that each IPL is independent and capable of preventing the hazard from escalating.
Step 5-> Evaluate IPL Effectiveness: Assess the effectiveness of each IPL by calculating its PFD. The lower the PFD, the more effective the IPL is in reducing risk.
Step 6 -> Determine Risk Reduction: Calculate the overall risk reduction achieved by the combination of IPLs. This involves summing the PFDs of all IPLs to determine the cumulative risk reduction.
Step 7 -> Compare with Risk Tolerance Criteria: Compare the residual risk (after considering IPLs) with the organization’s risk tolerance criteria. If the residual risk is above the acceptable level, additional risk reduction measures are necessary.
➢ FTA – Fault Tree Analysis (Quantitative Methods)
FTA is especially useful in Safety Integrity Level (SIL) determinations because it provides a detailed, quantitative assessment of system reliability and identifies the root causes of potential failures.
The Components of FTA are,
- Top Event: The undesired event or system failure that the analysis aims to prevent. This event is placed at the top of the fault tree.
- Intermediate Events: Events that occur as a result of one or more basic events. These are represented as nodes in the tree that lead to the top event.
- Basic Events: The root causes or failures that do not need further development and are the fundamental reasons for the occurrence of intermediate events. Basic events are represented at the bottom level of the tree.
- Logical Gates: Symbols used to represent the relationship between different events in the fault tree. Common gates include:
- AND Gate: Represents a scenario where all input events must occur for the output event to happen.
- OR Gate: Represents a scenario where any input event can cause the output event.
Steps in Conducting FTA for SIL Determination
- Define the Top Event
- Clearly define the undesired top event or system failure. This could be a catastrophic event, such as an explosion, system shutdown, or equipment failure.
- Identify Intermediate and Basic Events
- Break down the top event into intermediate events, which are the immediate causes leading to the top event. Further break down intermediate events into basic events, identifying the fundamental causes or failures.
- Construct the Fault Tree
- Start with the top event and use logical gates to connect intermediate and basic events. This creates a tree-like structure that visually represents the failure pathways.
- Quantify the Probability of Basic Events
- Determine the probability of occurrence for each basic event. This data can be obtained from historical records, reliability databases, or expert judgment.
- Calculate the Probability of Intermediate Events
- Use Boolean algebra and probability theory to calculate the likelihood of intermediate events based on the probabilities of the basic events and the logic gates connecting them.
- Determine the Probability of the Top Event
- Combine the probabilities of intermediate events to quantify the probability of the top event. This provides a quantitative measure of the system’s overall risk.
- Analyze and Interpret Results
-
- Analyze the fault tree to identify the most critical basic events and failure pathways. Use this information to prioritize risk reduction measures and determine the appropriate SIL.
Conclusion
Determining the appropriate Safety Integrity Level (SIL) for safety instrumented functions (SIFs) is important for ensuring the reliability and safety of industrial processes. Various methods, including Risk Graphs, Layer of Protection Analysis (LOPA), and Fault Tree Analysis (FTA), offer structured approaches to evaluating and mitigating risks.
Each method has its unique strengths, from the simplicity and quick assessment of Risk Graphs to the detailed and quantitative analysis provided by FTA. Understanding and applying these methods help organizations achieve compliance with safety standards, optimize maintenance plans, and enhance overall safety performance.
Want to discuss your projects for a SIL/LOPA Study? Make an Enquiry.
[…] of failure of an SIF. If the calculated PFD falls within the range defined for a specific SIL, that level is considered adequate. FTA also supports design optimization by showing where […]
[…] organizations to identify critical scenarios, analyze protection layers, and assign the right SIL based on actual risk exposure. In this article, we present a step-by-step framework for SIL […]
[…] the domain of process safety management (PSM), the determination of the Safety Integrity Level (SIL) is a crucial activity that ensures safety instrumented systems (SIS) perform reliably when […]
[…] robust process safety management (PSM), assigning a Safety Integrity Level (SIL) is only half the journey the other half is proving that the implemented safety instrumented […]