| Summary: Process safety metrics, essential for evaluating Process Safety Management (PSM) programs, encompassing leading and lagging indicators. Leading indicators like risk assessments, near-miss reports, and safety culture surveys proactively identify hazards. Lagging indicators such as incident rates, compliance with regulations, and corrective action completion rate analyze past incidents to improve future safety. |
Process safety metrics are measures that are used to evaluate and track the performance of a facility’s process safety management (PSM) program. By tracking these metrics, organisation can identify areas where their PSM program is effective and areas where it needs improvement. This information is then used to make informed decisions about safety investments and to prioritize corrective actions.
One of the key benefits of process safety metrics is their ability to provide a comprehensive picture of the safety health of an organization. These metrics encompass a wide range of aspects, including leading and lagging indicators, performance indicators, and compliance with safety regulations.
Types of Process Safety Metrics (Or Process Safety Performance Indicators)
There are a number of different types of process safety metrics that can are used to measure performance. These are also referred to as Process Safety Performance Indicators.
One of the key elements of process safety performance indicators is the use of key performance indicators (KPIs). These KPIs serve as measurable parameters that provide a quantitative or qualitative measure of the organization’s safety performance.
Some common process safety KPIs include:
- Incident rate: The number of incidents per unit of time, such as per year or per 100,000 hours worked. This metric can be used to track trends in process safety performance over time.
- Fatality rate: The number of fatalities per unit of time. This metric is a more severe measure of process safety performance than the incident rate.
- Injury rate: The number of injuries per unit of time. This metric is less severe than the fatality rate, but it is still an important measure of process safety performance.
- Total cost of incidents: The total cost of all incidents, including the cost of property damage, lost production, and medical expenses. This metric is a comprehensive measure of the economic impact of process safety incidents.
- Near- miss rate: The number of near misses per unit of time. Near misses are events that could have resulted in an incident but did not. Tracking the near-miss rate can help to identify potential hazards and prevent future incidents.
- Hazard identification rate: The number of hazards identified per unit of time. This metric can be used to track the effectiveness of hazard identification programs.
- Risk assessment rate: The number of risk assessments performed per unit of time. This metric can be used to track the effectiveness of risk assessment programs.
- Corrective action rate: The number of corrective actions taken per unit of time. This metric can be used to track the effectiveness of corrective action programs.
In addition to these metrics, there are a number of other metrics that can be used to measure process safety performance. The specific metrics that are used will vary depending on the industry and the specific hazards that are present.
What are the leading and lagging metrics in the process safety industry?
According to the American Institute of Chemical Engineers (AIChE), there are several metrics that companies should consider to evaluate their process safety performance. CCPS formed a committee to publish a Guideline defining uniform metrics that could serve as a global standard, in 2006. The committee have published recommendations for leading and lagging PSM performance metrics.
Leading Indicators and their role in proactive hazard identification
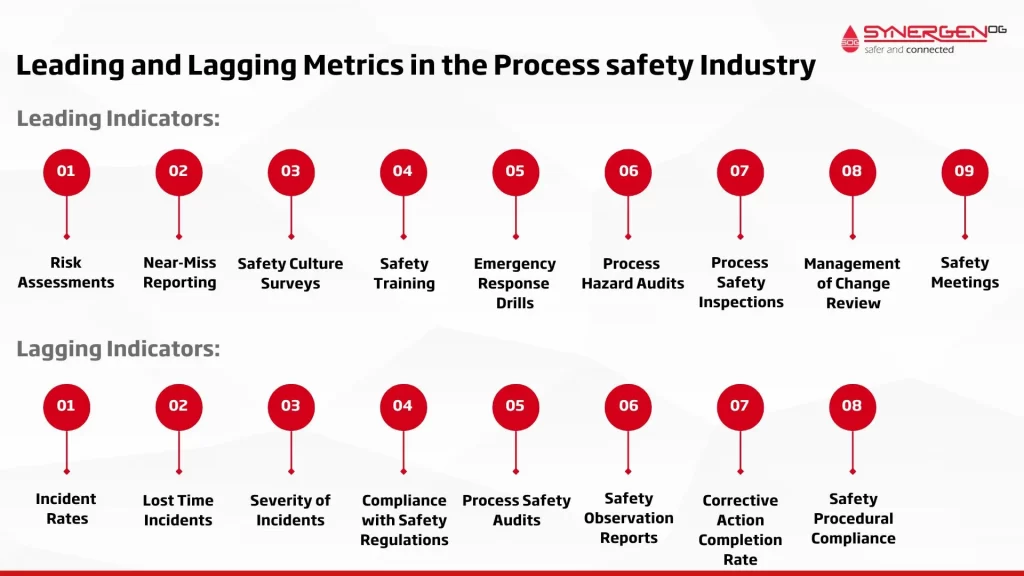
By utilizing leading indicators, organizations can take a proactive approach to identify potential hazards before they result in process incidents. Leading indicators can include risk assessments, near-miss reporting, and safety culture surveys. These metrics help organisation identify trends, spot potential weaknesses, and take preventive measures to mitigate risks.
Leading Indicators:
- Risk Assessments: Measuring potential hazards and identifying risks before they result in incidents.
- Near-Miss Reporting: Reporting incidents or situations that did not result in harm but had the potential to cause an incident.
- Safety Culture Surveys: Assessing the attitudes, beliefs, and behaviours of employees towards safety to identify areas for improvement.
- Safety Training: Measuring the effectiveness and completeness of safety training programs.
- Emergency Response Drills: Conducting regular drills to test the organization’s preparedness and response to process safety incidents.
- Process Hazard Audits: Evaluating the effectiveness of hazard identification and risk management processes.
- Process Safety Inspections: Regularly inspecting process equipment and procedures to identify and address potential safety hazards.
- Management of Change Review: Assessing the impact of changes in processes, equipment, or personnel on process safety.
- Safety Meetings: Holding regular safety meetings to discuss safety concerns and promote open communication.
Lagging Indicators and their use in analyzing past incidents
On the other hand, lagging indicators are reactive measures that look at incidents that have already occurred. Lagging indicators can include injury rates, accident investigations, and incidents related to process safety. While lagging indicators are important for understanding past incidents and patterns, they mainly serve as a way to learn from mistakes and improve future safety measures.
Lagging Indicators:
- Incident Rates: Measuring the number and frequency of incidents, injuries, and near misses.
- Lost Time Incidents: Tracking incidents that result in employees missing work due to injuries.
- Severity of Incidents: Evaluating the severity of incidents based on the extent of injuries or damages.
- Compliance with Safety Regulations: Assessing the organization’s adherence to safety regulations and standards.
- Process Safety Audits: Conducting audits to evaluate the effectiveness of process safety management systems.
- Safety Observation Reports: Documenting observations and concerns related to safety during routine work.
- Corrective Action Completion Rate: Tracking the rate at which corrective actions are recommended after incidents or audits are implemented.
- Safety Procedural Compliance: Assessing the adherence to established safety procedures and protocols.
It is important to note that the specific leading and lagging indicators used may vary depending on the industry, organization, and specific processes involved. These indicators should be selected and tailored to best reflect the organization’s unique safety risks and priorities.
Regular monitoring and analysis of leading and lagging indicators allow organizations to proactively manage risks, continuously improve safety performance, and prevent incidents.
Examples of Process Safety Metrics in Various Industries
Process safety metrics is extremely important in various industries, including chemical manufacturing, oil and gas, and pharmaceuticals. These metrics help organizations identify, monitor, and manage process safety risks to prevent incidents and improve safety performance.
Here are some examples of process safety metrics utilized in these industries:
Chemical Manufacturing:
- Number of Process Safety Incidents: Tracking the frequency and nature of incidents related to chemical processes, such as leaks, spills, or explosions.
- Process Safety Risk Assessments: Conducting thorough and regular risk assessments to identify potential hazards and assess their associated risks.
- Compliance with Safety Procedures: Evaluating the adherence to established safety procedures and protocols during chemical manufacturing processes.
- Process Safety Management System Audits: Assessing the effectiveness of process safety management systems through audits and inspections.
Oil and Gas:
- Process Safety Leading Indicators: Monitoring leading indicators such as near-miss reporting, safety training completion rates, and safety culture surveys.
- Process Safety Incident Rate: Measuring the number of incidents per million hours worked to track the safety performance within the oil and gas industry.
- Safety Observations and Corrective Action Completion: Documenting safety observation reports and tracking the completion of corrective actions to address identified issues.
- Asset Integrity Metrics: Monitoring the integrity and reliability of critical assets such as pipelines, storage tanks, and pressure vessels.
Pharmaceuticals:
- Compliance with Good Manufacturing Practices (GMP): Assessing adherence to established GMP guidelines to ensure the safety and quality of pharmaceutical manufacturing.
- Process Safety Incident Investigations: Conducting thorough investigations of any process safety incidents to identify root causes and prevent recurrence.
- Training and Competence: Evaluating the effectiveness and completeness of process safety training programs for pharmaceutical manufacturing personnel.
- Environmental Impact Metrics: Monitoring and reducing the environmental impact of pharmaceutical manufacturing processes, such as waste generation or emissions.
Benefits of Using Process Safety Metrics
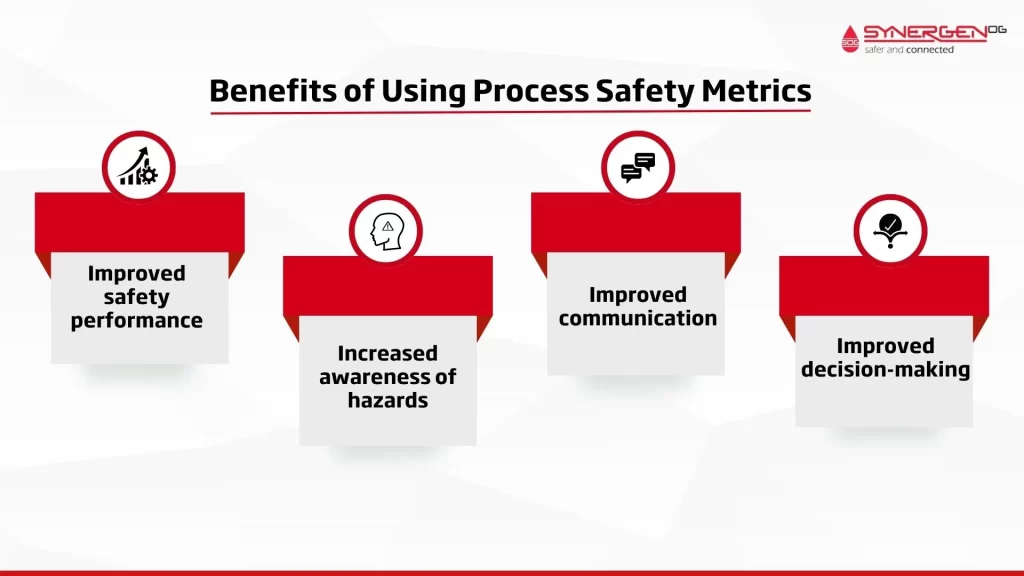
There are a number of benefits to using process safety metrics. These benefits include:
Improved safety performance
By tracking process safety metrics, organizations can identify areas where their PSM program is effective and areas where it needs improvement. This information can then be used to make informed decisions about safety investments and to prioritize corrective actions.
Increased awareness of hazards
Tracking process safety metrics can help to increase awareness of hazards and potential incidents. This can help to prevent incidents from occurring in the first place.
Improved communication
Process safety metrics can be used to communicate the status of the PSM program to employees, management, and other stakeholders. This can help to build trust and support for the PSM program.
Improved decision-making
Process safety metrics can be used to make informed decisions about safety investments and corrective actions. This can help to ensure that resources are used effectively and that the PSM program is effective.
What are the Challenges of Using Process Safety Metrics
Using process safety metrics has several challenges. Some of them are,
- Defining metrics: Determining what metrics are appropriate for a particular organisation will be challenging. The specific metrics that are used will vary depending on the industry and the specific hazards that are present.
- Collecting data: The collection of accurate and timely data on process safety metrics can be difficult. This is especially true for metrics such as near misses and hazard identification.
- Interpreting data: It can be difficult to interpret the data collected on the performance indicators. This is because the data can be affected by a number of factors, such as changes in the operating environment or the implementation of new safety procedures.
Implementing and Measuring Process Safety Metrics in Your Organisation
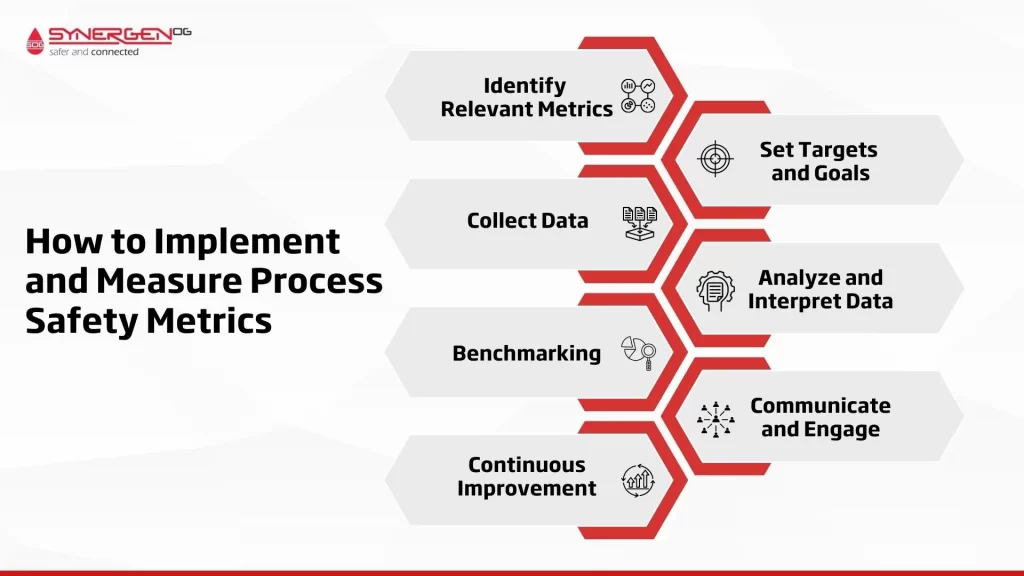
Implementing and measuring process safety metrics in your organisation is an important step towards improving safety performance and preventing incidents. Here are some steps to consider when implementing process safety metrics:
- Identify Relevant Metrics: Determine the process safety metrics that are most relevant to your organization and industry. Consider both leading indicators (e.g., risk assessments, near-miss reporting) and lagging indicators (e.g., incident rates, compliance with safety regulations) to gain a comprehensive understanding of safety performance.
- Set Targets and Goals: Establish specific targets and goals for each process safety metric to drive continuous improvement. Set realistic and achievable targets that align with industry benchmarks, legal requirements, and organizational objectives.
- Collect Data: Implement a robust data collection process to gather accurate and reliable information for the identified process safety metrics. Establish clear guidelines and protocols for data collection, ensuring consistency and standardization.
- Analyze and Interpret Data: Regularly analyze the collected data to gain insights into safety performance trends and identify areas for improvement. Use statistical tools and techniques to identify correlations, patterns, and anomalies in the data to inform decision-making.
- Benchmarking: Compare your organization’s process safety metrics against industry standards, best practices, and other organizations within your industry. Benchmarking provides valuable insights and helps identify areas where improvements can be made.
- Communicate and Engage: Share process safety metrics and progress with all levels of the organization, from management to frontline employees. Effective communication and engagement create a safety-conscious culture and encourage active participation in safety initiatives.
- Continuous Improvement: Use the insights gained from analyzing process safety metrics to make informed decisions and implement corrective actions. Continuously monitor, review, and adjust your process safety metrics and targets to ensure they remain relevant and aligned with changing circumstances.
When collecting, analysing, and interpreting process safety metrics, it is essential to follow best practices:
- Accuracy and Reliability: Ensure that data collection methods are accurate and reliable. Use standardized procedures and train employees who are responsible for data collection to promote consistency.
- Timeliness: Collect and analyze process safety metrics in a timely manner to monitor safety performance and address any emerging issues promptly.
- Contextualize Data: Contextualize the data by considering factors such as organizational size, complexity, and specific process risks. Understanding the context enables a more accurate interpretation of the metrics.
- Trend Analysis: Look for trends and patterns by analyzing process safety metrics over time. This helps identify improvement areas and track the impact of implemented safety initiatives.
- Root Cause Analysis: Conduct root cause analysis for incidents or deviations identified through process safety metrics. Understanding the underlying causes helps develop effective corrective actions for sustainable improvement.
To facilitate the measurement and tracking of process safety metrics, organizations can leverage various tools and technologies:
- Data Management Systems: Implement a robust data management system that allows for efficient data collection, storage, and analysis. This can be a dedicated software solution or customized databases.
- Automation and Monitoring Systems: Utilize automation and monitoring systems to collect real-time data from process equipment, sensors, and alarms. These systems provide valuable insights into process conditions and can help identify potential safety risks.
- Dashboards and Reporting Tools: Use dashboards and reporting tools to visualize and analyze process safety metrics, making it easier to monitor performance and communicate key information to stakeholders.
- Safety Management Software: Implement safety management software that can help streamline the process of collecting, analyzing, and reporting process safety metrics. These software solutions often include modules for incident management, risk assessments, and compliance tracking.
It is important to continuously review and evaluate the effectiveness of the chosen metrics and adjust them as needed to meet changing organizational needs and industry standards.
Conclusion
Process safety metrics are an important tool for improving safety performance. By tracking these metrics, organizations can identify areas where their PSM program is effective and areas where it needs improvement. This information can then be used to make informed decisions about safety investments and to prioritize corrective actions.
References:
[…] Process safety reviews help organizations identify risk issues before actual occurrences, making them a critical upstream tool for preventing incidents rather than simply responding to them. […]